Network performance in context
View network topology, performance layers and complaint density together. Move from a network overview to the sites and sectors that need closer attention.


GIS-NATIVE NETWORK VISUALIZATION
Bring network performance, drive-test results and customer complaints onto one map. Tracer helps your teams pinpoint problem areas, investigate likely causes and prioritise corrective action.
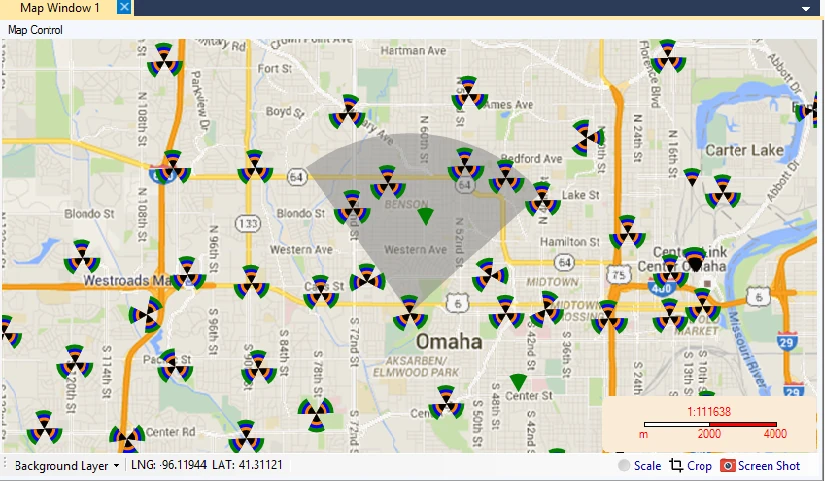
ONE GEOGRAPHIC VIEW
Tracer brings network configuration, performance, events, drive-test measurements and customer complaints into a shared geographic view, revealing relationships that isolated datasets can miss. Correlate customer-impacting problems with radio conditions, cell loading and configuration to distinguish coverage, capacity and mobility issues, narrow down likely causes and focus corrective action.
A SHARED GEOGRAPHIC WORKSPACE
Bring configuration, performance, events, field measurements and complaint locations into the same investigation.
Network configuration
Network performance
Events
Drive-test measurements
Customer complaints
Coverage · Capacity · Mobility
Examine affected areas, routes and nearby cells.
Review performance, configuration and field data together.
Focus engineering review and corrective action.
FROM MEASUREMENTS TO INVESTIGATION
Drive tests demand time, budget and field effort. Tracer turns the data they generate into findings your engineers can use.
Automated analysis identifies poor-quality patches, surfaces potential causes and suggests remedial actions for engineering review. Give your teams a repeatable starting point for diagnosis and a clearer basis for deciding what to investigate next.
INVESTIGATE WITH PRECISION
View network topology, performance layers and complaint density together. Move from a network overview to the sites and sectors that need closer attention.
Identify poor-coverage patches in drive-test data. Examine the affected routes and serving cells to focus investigation on specific locations.
Surface missing neighbour relationships and investigate potential handover issues. Review the evidence behind proposed neighbour-list changes.
Identify suspected sector swaps and investigate tilt and azimuth issues against field measurements. Focus configuration reviews where the data points to a problem.
View elevation profiles alongside network and drive-test data. Assess how the surrounding terrain may contribute to observed coverage conditions.
Analyze data across vendors, technologies and network layers. Use multiple map views to compare areas and examine different aspects of network behaviour.
YOUR EVERYDAY WORK
Locate performance issues and assess the RF, configuration and neighbour relationships that may explain them.
Turn collected measurements into mapped findings and suggested actions for review.
Connect complaint locations and clusters with nearby network data to support investigation and resolution.
DATA & INTEGRATION
Bring configuration and performance data, drive-test logs and customer complaints into Tracer. Integrate with existing OSS platforms and data lakes through API connectivity.
Scheduled ingestion and data-quality checks support consistent analysis. Role-based access and encryption protect sensitive information, while flexible exports help teams share findings through existing operational workflows.
THE NEXT STEP
See how a shared geographic view can sharpen your next network investigation.
Contact us at info@kanadnetworks.com.